QR error correction helps and hinders scanning
Error correction sounds good. It means fewer errors, right? When it comes to QR codes, that’ll mean easier scanning for people, surely? It seems like that’s not the whole story.
I wondered about this, and couldn’t find an answer, so I did some exploration, and found there’s two factors in tension: the error correction on one hand, and the resulting data density on the other:
- For fixed data, like a particular URL, it’s easier to read a QR code with lower error correction, but only when there’s minimal damage to the code (like reflections and dirt).
- Error correction works as advertised when there’s damage: higher error correction means more codes can be read.
The rest of this article explores what this means.
Quick intro to quick response
QR (quick response) codes are now extremely widespread in Australia, because they’re used for COVID contact tracing check-ins and placed in every shop window, but they’re somewhat magic. Before diving into the details, Wikipedia says a whole lot about QR codes; the summary is: a QR code is a pattern of black and white squares that encodes some data (often a URL), that cameras can read.
The article even has diagrams. Here’s one with a whole lot of detail, highlighting a bunch of key concepts going into a QR code, however there’s two that are most important when considering how easy it is to scan a QR code: version and error correction.

A diagram of the functional parts of a QR code. source
What are these two factors?
-
error correction (EC): a measure of redundancy in the QR code, translating into how much “damage” it can tolerate and still be readable. This is how images and logos can be directly embedded into QR codes, without any special consideration. This is chosen when creating the QR code. The number of modules that can be damaged for each level is:
EC max damage L (low) 7% M (medium) 15% Q (quartile) 25% H (high) 30% -
version: the number of little squares (modules) along each side of the big square. This is normally computed automatically when creating the QR code (from the data and error correction).
version modules 1 21 2 25 … … n 4n + 17 … … 39 173 40 177
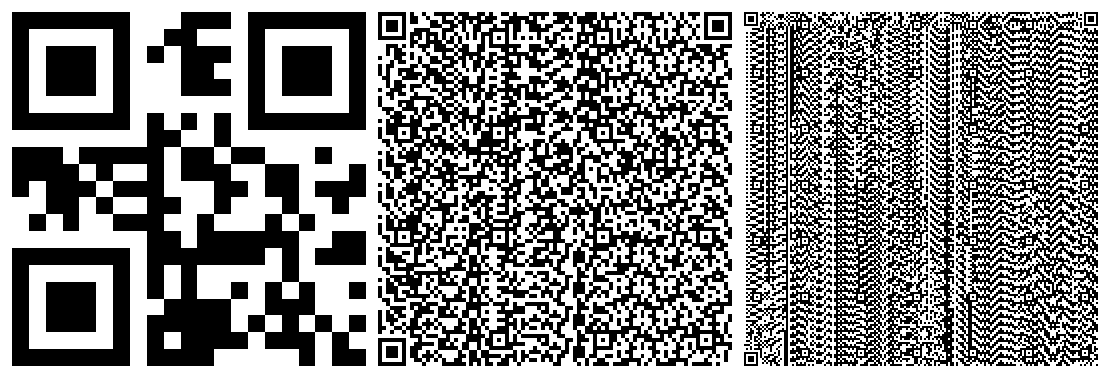
Three QR codes, using versions 1, 18 and 40 (from left to right).
Together, the version and error correction dictate how much data a given QR code can store0:
The number of bytes a QR code can store, at each version and EC level. (This can be read horizontally too: for a given number of bytes, what version is required?)
(The plots in this article are interactive: hover/tap for more info, tap or double tap the legend to toggle series’ visibility, tap-and-drag to zoom, and hit the ‘home’ icon to reset.)
That plot indicates a QR code using EC level H can store less than half the data of one using level L: the closest they get is at version 3 (53 vs. 24 bytes). The other levels have less overhead, but it’s still a cost that’s paid:
| EC | max bytes (version 40) | storage relative to L (mean) |
|---|---|---|
| L | 2953 | 100% |
| M | 2331 | 79% |
| Q | 1663 | 57% |
| H | 1273 | 43% |
That’s some hefty overhead: presumably it is useful for something… I did some experiments.
Experiments
I set up a little Rust program that ran ZBar against an exhaustive set of different QR configurations: all 40 versions and all 4 EC levels. For each of these 160 configurations:
- scale the QR code to given size
- place it into a background image, to simulate “real world” conditions
- pass the resulting image into ZBar and check if it scans successfully
- repeat at different sizes to find the smallest size at which the QR code scans successfully, or determine that it couldn’t be scanned at any size

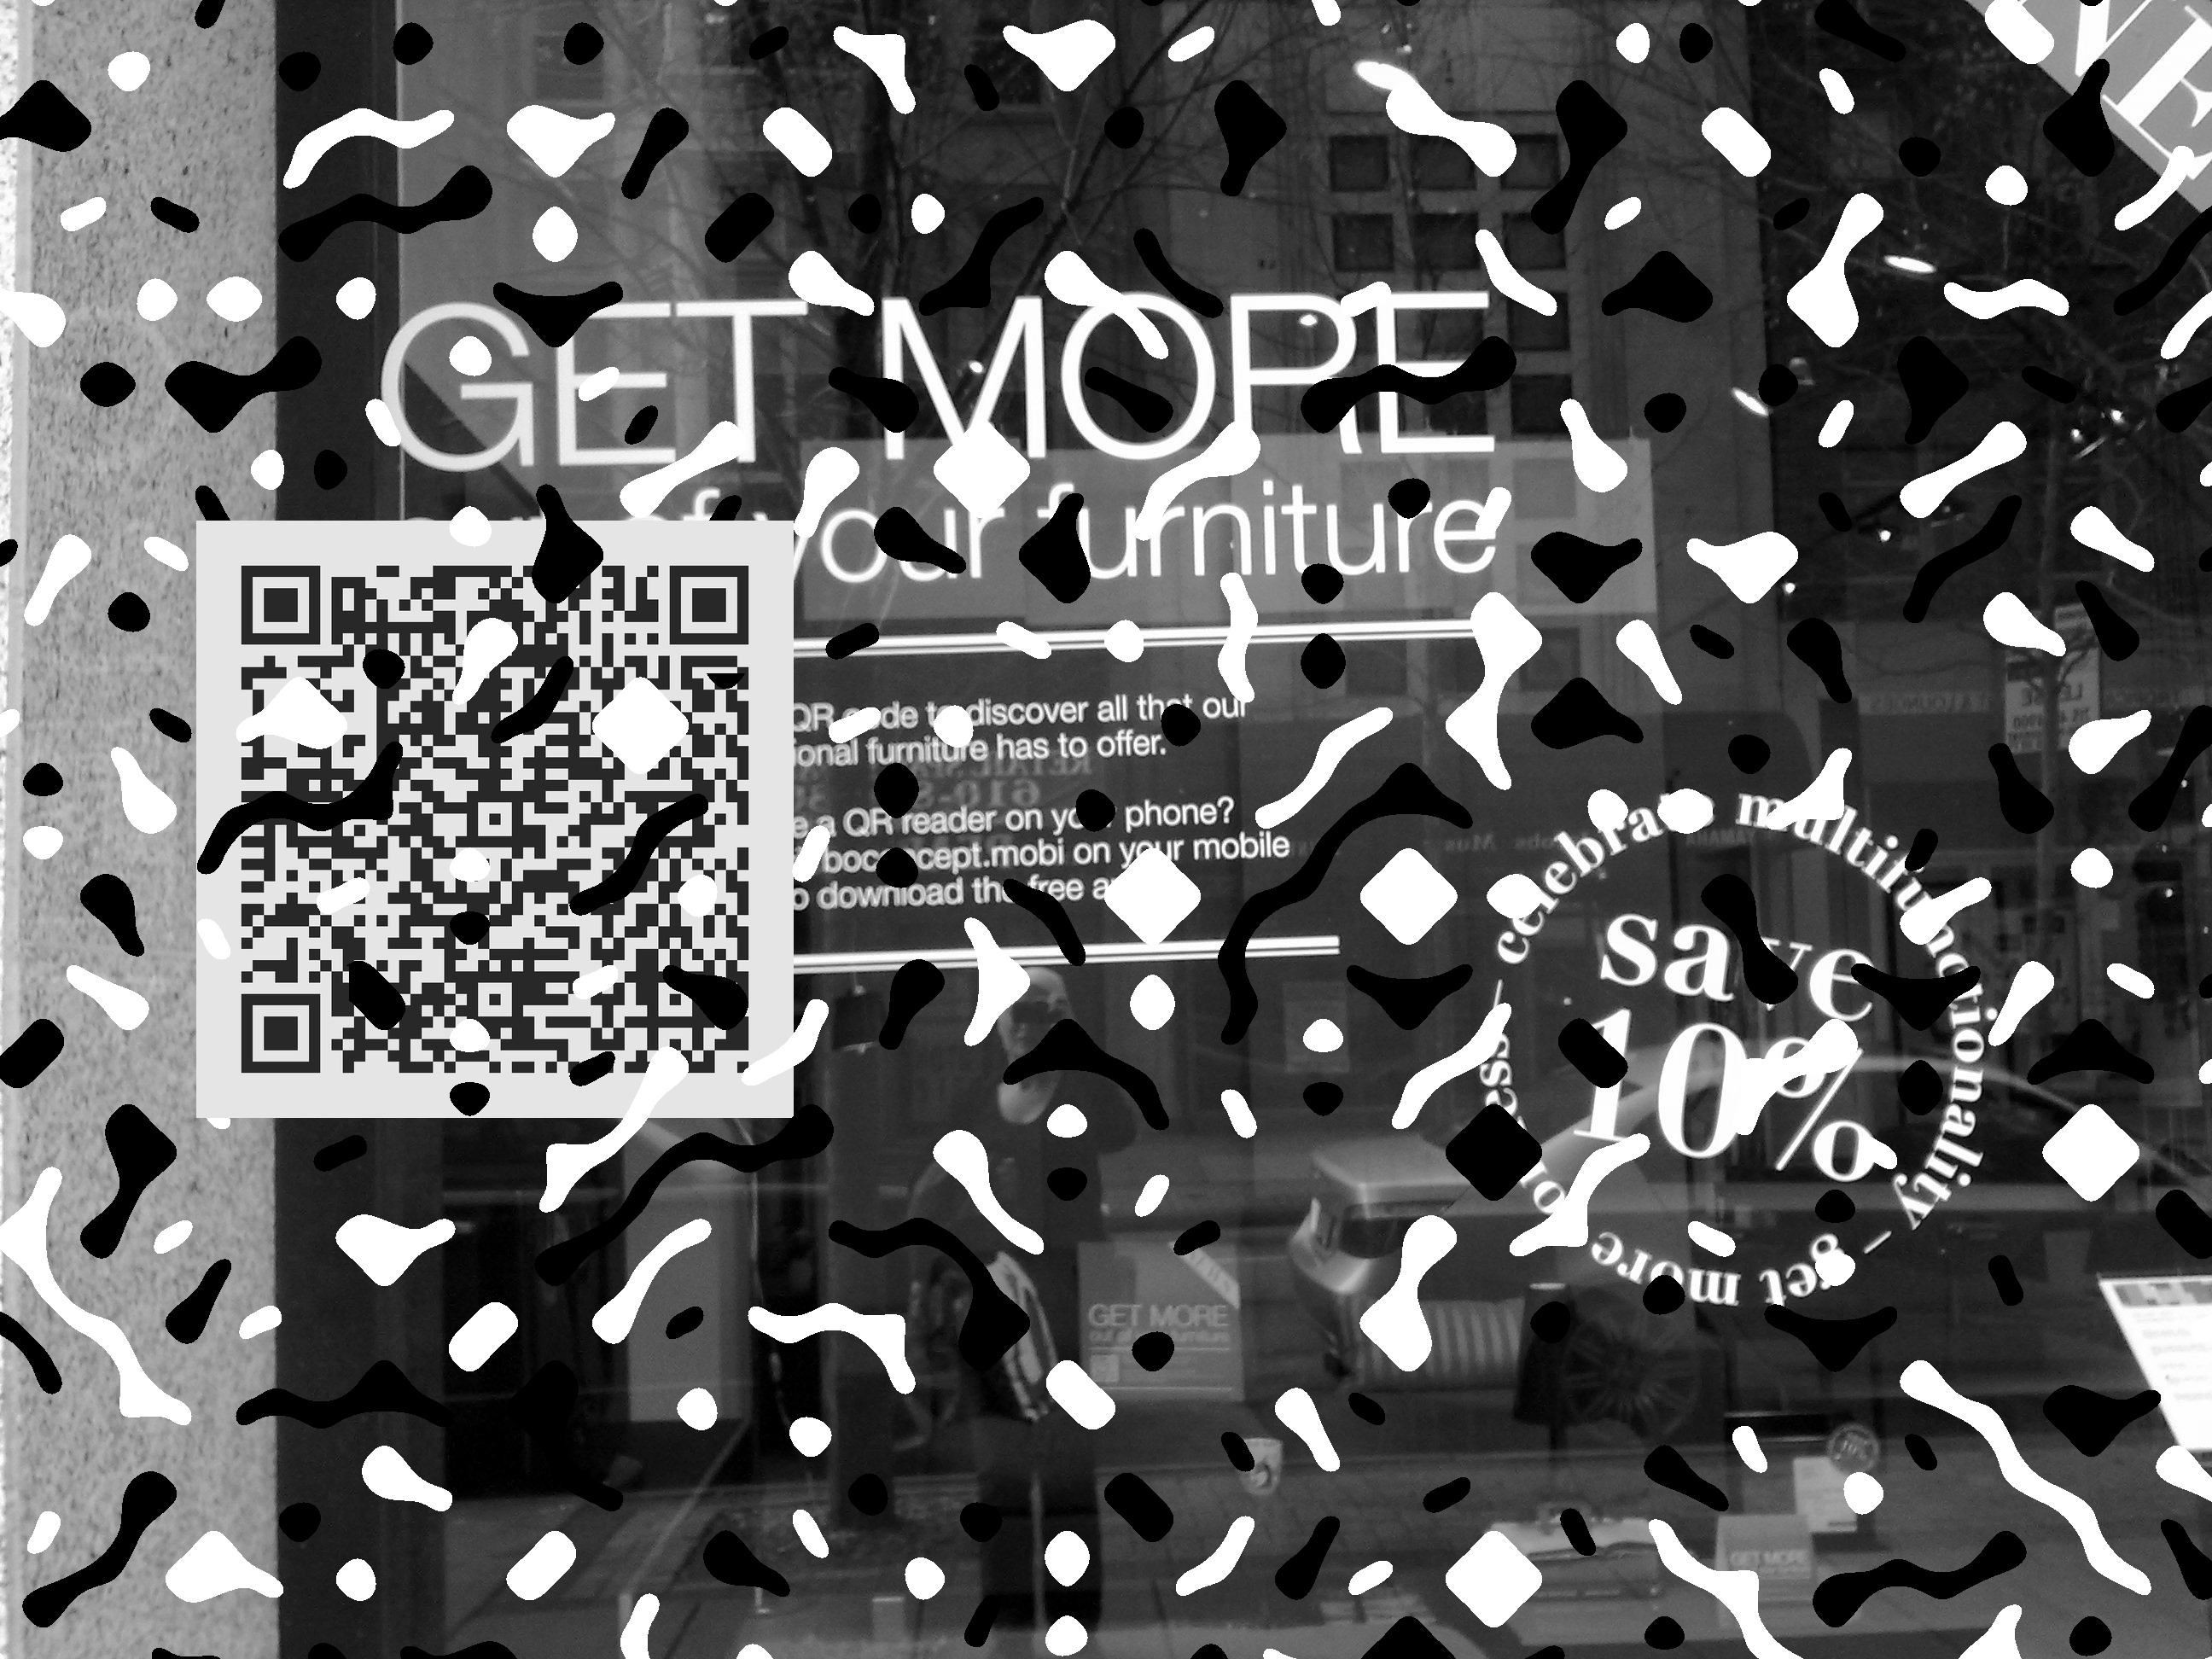
An excerpt of an example of the generated image: the code is EC level H and version 7, and has been scaled to 700 pixels on each size. Tap for full size.
Error correction makes scanning more reliable
Error correction sounds useful for scanning: if the QR code is further away or smaller, then there’s more likely to be blurriness or other “damage”, and so higher error-correction will make it easier to read… right?
A camera generally doesn’t care about the actual distance, as it just “thinks” in the pixels it sees. Thus, it’s the size of the QR code within the overall image that matters. I call this the field of view. Example, for the full sized version of Figure 4:
| size (px) | total (px) | field of view | |
|---|---|---|---|
| full image | 2592 × 1944 | 5.04m | 100% |
| QR code | 700 × 700 | 0.49m | 9.7% |
Under the reasonable assumption that the camera is close to rectilinear, this gives a measure of how close the user has to be that scales smoothly with the physical size of the QR code: if the device can read a 10cm QR code from 1m away, it’ll be able to read a 1m code from 10m. Similarly, fields of view can be used to predict distance: given two codes, where the first needs 4% field of view and the second only needs 1%, the second can likely be scanned from about twice as far1.
Error correction definitely allows scanning a given QR code from further away. At version 40, a level H QR code only requires 1.7% field of view, while a level L one requires 2.4%.
The field of view required to scan a QR code of a given version, at each EC level (lower is better).
This seems to all come back to the size of the individual modules (the small squares that make up the overall QR code):
The field of view of an individual module required to scan a QR code of a given version, at each EC level (lower is better).
The lines of best fit look pretty flat, and quantitative measures like the parameter confidence intervals agree (except for level L, the 95% confidence intervals on the slope coefficient include 0). In other words: a QR code is scannable if its modules are sufficiently large, and that size threshold doesn’t change much as the version changes.
On the other hand, the size threshold does change with EC level: level L modules need to be 25-35% larger than level H ones, matching the intuition about the benefits of higher error correction.
Cool, hypothesis confirmed: error correction makes scanning more reliable…
Error correction makes scanning less reliable
Not so fast! When creating a QR code, versions and module sizes usually don’t matter, it’s the data that matters: one will usually choose the data and error correction, and then have the version computed automatically, as the smallest that works.
The overhead of higher error correction matters a lot.

This post’s URL encoded at EC level L (left) and EC level H. At level L, the data fits in a version 3 code, while level H requires version 6, resulting in smaller modules (half the area/field of view).
If we change from looking at the version to the actual data stored, the ordering reverses, and EC level L works best!
The field of view required to scan a QR code containing a given amount of data, at each EC level (lower is better).
If one is trying to “send” 1000 bytes via QR code, using level H requires a field of view of 1.4%, while level L only needs half that (approximately), at 0.8%. This means a device can be further away and still read the L code successfully.
This doesn’t seem to match the results in Figures 5 and 6. What’s going on? The level L code uses version 22 with 1052 ≈ 11k modules, while level H requires version 36 with 1612 ≈ 26k modules. This ratio (2.35) is much larger than the ratio between the module sizes (~1.3), so, sure, level H allows the individual modules to be smaller, but it requires using so many more that the overall QR code is larger than the level L ones2.
This seems to apply consistently across versions, as might be expected from Figure 3: a QR code at level L can store twice as much data as one at level H, for the same version. The data storage overhead of error correction doesn’t seem be worth the apparently dubious benefits.
Nice. This hypothesis—error correction makes scanning less reliable—is correct, right?
Error correction really does make scanning more reliable
There is more to the story. Those measures had no noise introduced to the QR codes. They’re the easy cases. What happens if we turn up the noise?
I generated 10 different noise patterns, and thresholded them at 8 different levels, and overlaid this noise across each of the QR codes, for a total of 160 × 80 = 12800 configurations. This is meant to simulate reflections and dirt that could make it harder for a device to read the code.
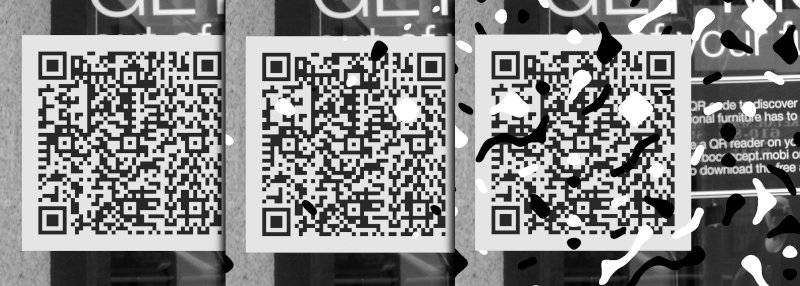
Three levels of damage to the example QR code in Figure 4: no damage (full), some regions of white and black noise (full), even more and larger regions of noise (full).
Across all of these experiments, 60% more EC level H QR codes could be scanned successfully than level L ones:
| EC | number successfully scanned |
|---|---|
| L | 1257 |
| M | 1600 |
| Q | 1839 |
| H | 2001 |
This is driven by resilience to damage: the QR code at level H is more likely to be able to be read when there’s significant damage. The following plot has a point for each successful scan, against the percentage of pixels damaged.
The amount of damage sustained by successfully scanned QR codes. The hover information displays the number of points to the left of the line (number of successful scans up to and including that amount of damage).
Under these experimental conditions, level L codes become much less readable above ~6% damage, level M above ~12%, level Q above ~18% and level H above ~20%. This correlates with the resilience I quoted in the table above.
Conclusion
I’ve learnt that the four different QR error correction levels influence both data volume and ability to scan. For a given QR version, increasing error correction allows storing less data, but makes scanning easier and more reliable. However, for storing a fixed amount of data, like a particular URL, the version is computed automatically, and the easier scanning can trade off against the data volume. This ties back to the size of the individual modules (little squares): there is a minimum certain size before a code is scannable, and so a denser code needs to be larger.
Experimental caveats
The results I’ve talked about here are all empirical, and there’s a bunch of reasons that they’re not perfect:
- I tested only one method of reading QR codes, ZBar, although some quick experiments with my iPhone seem to correlate with the results here.
- I also tested only one background image, so the behaviour may differ greatly with QR codes contained in different surrounds.
- The QR codes are generated to be perfectly rectangular and aligned to the image pixel grid, which is unlikely to happen in the real world.
- The noise generated is random Perlin noise, which isn’t likely to be what occurs in the real world.
- The overlaying of the noise carefully skips damaging the position patterns (the big squares in three corners), because the performance is catastrophically worse if they can be damaged too.
-
There’s also the concept of the mode: Numeric, Alphanumeric, Binary or Kanji. However, they all store an (approximately) equal number of bits, so I’ll just use the Binary mode, because I’m far more used to talking about bytes than bits.
Details: each mode defines an input character set and then an efficient way to encode those characters. For example, for Numeric, the permitted characters are 0, 1, …, 9, and they’re encoded with 3 digits in 10 bits. The Binary mode is probably familiar: one input byte is encoded into 8 bits in the QR code. To convert numbers in this post into bits, multiply by 8. To convert the number of bits to the number of input characters in each mode, divide by the appropriate coefficient (Numeric: 10/3; Alphanumeric: 11/2, Binary: 8, Kanji: 13). ↩
-
For fixed field of view, the distance scales linearly with the side length of the QR code and the field of view is proportional to the area, which scales (close to) quadratically with the side length, so the permitted distance is approximately inversely proportional to the square root of the required field of view: quadrupling the required field of view requires being half the distance (approximately). ↩
-
The various numbers flying around here match up: level L modules need to be ~30% larger than level H ones, and the level H QR code requires 2.35× more modules. This predicts that the level H code would have to be 2.35/1.3 = 1.81 times larger than level L one, and that’s pretty close to what we observed: 1.4/0.8 = 1.75. ↩